Untuk memantau OS Windows lakukan langkah-langkah sbb:
- Install NSClient++ addon pada OS WIndows
- Konfigurasi Pada Nagios Server demi OS Windows
- Konfigurasi service dan IP Host /Windows yang hendak dimonitoring
- Restart Ulang Nagios Service
Praktik:
jika gagal install gunakan file yang versi lamanya bisa donload di : https://sourceforge.net/projects/nscplus/files/OldFiles/NSClient%2B%2B-0.0.2-a2.zip/download atau sumber semuanya di :
+extract ke D:\NSClient
+jalankan run (via Administrator)

+cd D:\NSCLient
+ketik nsclient++ /install
+ketik nsclient++ SysTray

Lalu pada RUN ketik: services.msc
aktifkan / start NSCLient services

buka file NSC.INI pada drektori C:\NSClient
=>
uncomment all the modules defined in the “modules” section, except for CheckWMI.dll and RemoteConfiguration.dll.
=>
uncomment all the modules defined in the “modules” section, except for CheckWMI.dll and RemoteConfiguration.dll.
Bentuk akhirnya adalah sbb:
[log]
# LOG DEBUG
# Set to 1 if you want debug message printed in the log file (debug messages are always printed to stdout when run with -test)
;debug=0
# LOG FILE
# The file to print log statements to
;file=NSC.log
[Settings]
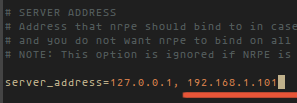
;# ALLOWED HOST ADDRESSES
; This is a comma-delimited list of IP address of hosts that are allowed to talk to the all daemons.
; If leave this blank anyone can access the deamon remotly (NSClient still requires a valid password).
; The syntax is host or ip/mask so 192.168.0.0/24 will allow anyone on that subnet access
allowed_hosts=192.168.1.103
[systray]
# SYSTRAY INJECT COMMAND
# The default command to show in the inject dialog from the event log.
defaultCommand=CheckEventLog Application warn.require.eventType=error warn.require.eventType=warning critical.require.eventType=error critical.exclude.eventType=info truncate=1024 descriptions
[NSClient]
# NSCLIENT PORT NUMBER
# This is the port the NSClientListener.dll will listen to.
port=12489
# PASSWORD
# This is the password (-s) that is required to access NSClient remotely
;password=
# ALLOWED HOST ADDRESSES
# This is a comma-delimited list of IP address of hosts that are allowed to talk to the NRPE daemon.
;allowed_hosts=
;adress=w.x.y.z (not yet implemented)
[NRPE]
# NRPE PORT NUMBER
# This is the port the NRPEListener.dll will listen to.
;port=5666
# ALLOWED HOST ADDRESSES
# This is a comma-delimited list of IP address of hosts that are allowed to talk to the NRPE daemon.
;allowed_hosts=
# COMMAND TIMEOUT
# This specifies the maximum number of seconds that the NRPE daemon will allow plug-ins to finish executing before killing them off.
;command_timeout=60
# COMMAND ARGUMENT PROCESSING
# This option determines whether or not the NRPE daemon will allow clients to specify arguments to commands that are executed.
;allow_arguments=0
# COMMAND ALLOW NASTY META CHARS
# This option determines whether or not the NRPE daemon will allow clients to specify nasty (as in |`&><'"\[]{}) characters in arguments.
;allow_nasty_meta_chars=0
;adress=w.x.y.z (not yet implemented)
;dont_blame_nrpe (renamed to 'allow_arguments' as it seemd to make more sense)
[NRPE Handlers]
# COMMAND DEFINITIONS
# Command definitions that this daemon will run.
# Can be either NRPE syntax:
command[check_users]=/usr/local/nagios/libexec/check_users -w 5 -c 10
# Or simplified syntax:
test=c:\test.bat foo $ARG1$ bar
check_disk1=/usr/local/nagios/libexec/check_disk -w 5 -c 10
# Or even loopback (inject) syntax (to run internal commands)
# This is a way to run "NSClient" commands and other internal module commands such as check eventlog etc.
check_cpu=inject checkCPU warn=80 crit=90 5 10 15
check_eventlog=inject CheckEventLog Application warn.require.eventType=error warn.require.eventType=warning critical.require.eventType=error critical.exclude.eventType=info truncate=1024 descriptions
# But be careful:
; dont_check=inject dont_check This will "loop forever" so be careful with the inject command...
[modules]
# NSCLIENT++ MODULES
# A list with DLLs to load at startup.
FileLogger.dll
CheckSystem.dll
CheckDisk.dll
NSClientListener.dll
NRPEListener.dll
SysTray.dll
CheckEventLog.dll
CheckHelpers.dll
;CheckWMI.dll
;
; RemoteConfiguration IS AN EXTREM EARLY IDEA SO DONT USE FOR PRODUCTION ENVIROMNEMTS!
;RemoteConfiguration.dll
; NSCA Agent is a new beta module use with care!
;NSCAAgent.dll
; LUA script module used to write your own "check deamon" (sort of) early beta.
;LUAScript.dll
; Script to check external scripts and/or internal aliases, early beta.
;CheckExternalScripts.dll
; Check other hosts through NRPE extreme beta and probably a bit dangerous! :)
;NRPEClient.dll
+++++++++++++++++++++++++++++++++++++++++++++++++++++++++Lalu restart : nsclient++ /start
NB ip 192.168.1.103 adalah ipnya server nagios
+++SELESAI DISII CLIENT SEKARANG TAMBAHKAN CODE DISISI SERVER
Configuring Nagios Server and Add Windows Hosts
SET IP CLIENT WINDOWS

Now Login into Nagios Server and add some object definitions in Nagios configuration files to monitor newWindows machine. Open windows.cfg file for editing with Vi editor.

Now Login into Nagios Server and add some object definitions in Nagios configuration files to monitor newWindows machine. Open windows.cfg file for editing with Vi editor.
A sample Windows host definition already defined for the Windows machine, you can simply change the host definition like host_name, alias, and address fields to appropriate values of your Windows machine.
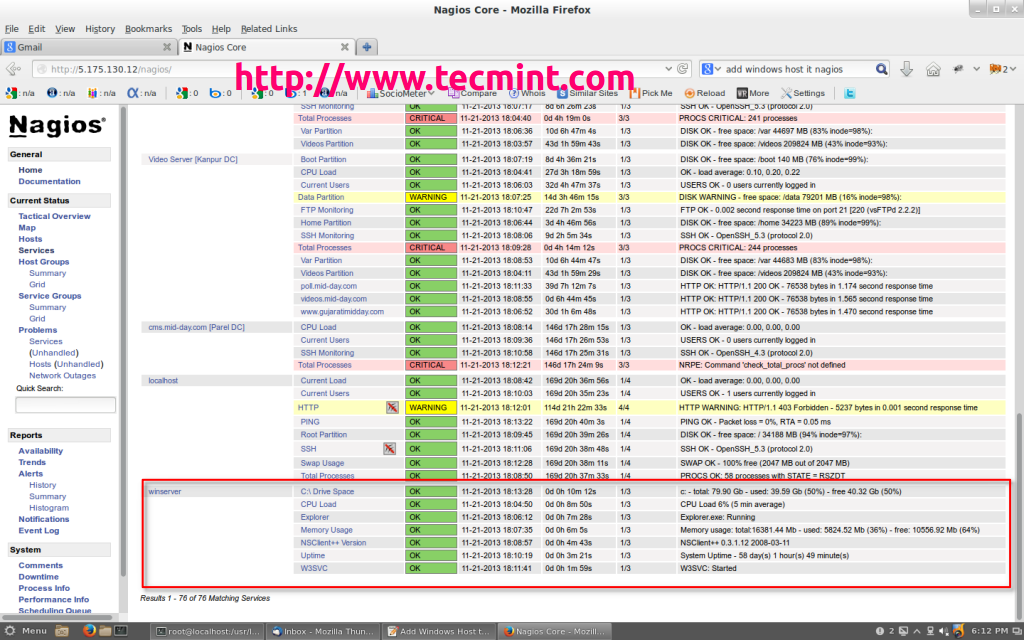
Following services are already added and enabled in windows.cfg file. If you wish to add some more other service definitions that needs to be monitored, you can simple add those definitions to same configuration file. Make sure to change the host_name for these all services with host_name defined in the above step.
Lastly, uncomment the windows.cfg file in /usr/local/nagios/etc/nagios.cfg.
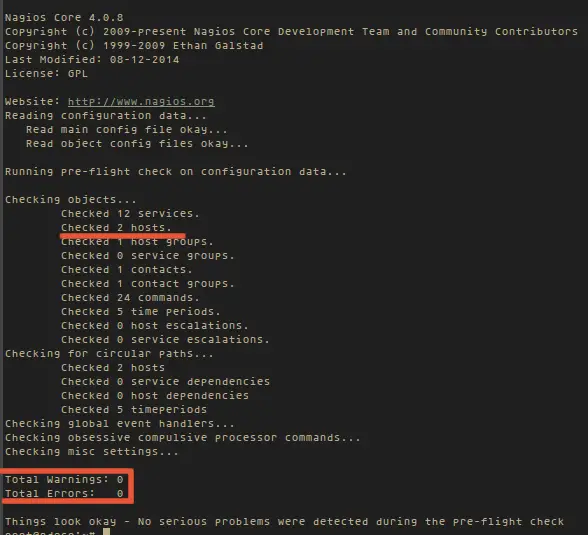
Finally, verify the Nagios configuration files for any erros.
If the verification process throws any error messages, fix those errors until the verification process completes without any error messages. Once’ you fix those errors, restart the Nagios service.
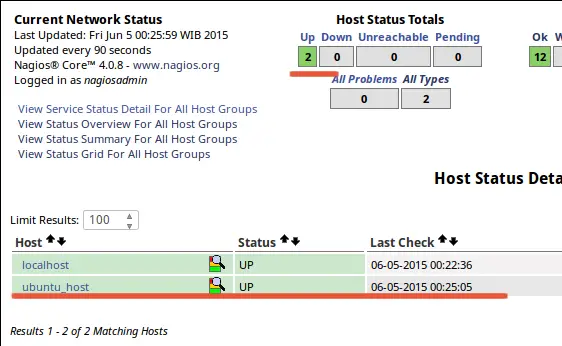
That’s it. Now go to Nagios Monitoring Web interface at “http://Your-server-IP-address/nagios” or “http://FQDN/nagios” and Provide the username “nagiosadmin” and password. Check that the Remote Windows Host was added and is being monitored.
Nagios Monitor Windows Host